Demand for LCVs continues at BCA
Dec 18, 2018
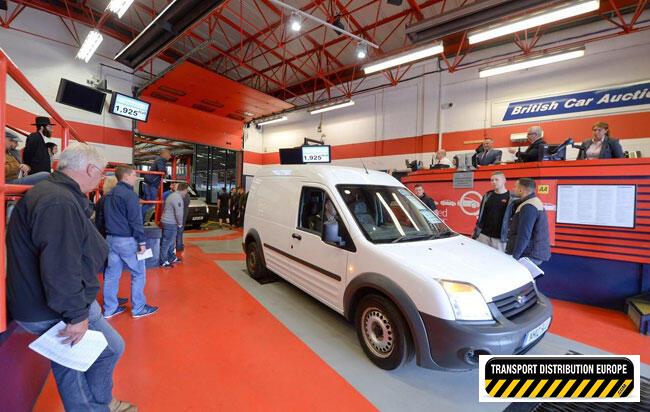
Average light commercial vehicle values continue to demonstrate long-term growth with LCVs averaging £7,146 at BCA in November – a rise of 5.1% compared to the same month in 2017 despite both average age and mileage rising. In-lane and online auctions were well attended throughout November, with confident bidding across the national network.
Buyer demand was sustained throughout the month, with good levels of supply from most sectors and at every price point. Buyers continued to focus on the best specified and presented vehicles, with hard-worked, damaged or base specification examples needing to be sensibly valued if they are to sell first time.
| Fleet/Lease | Avg Age (mnths) | Avg Mileage | Avg Value | Sale vs MRP |
| Nov 2017 | 39.07 | 60,530 | £7,727 | 38.13% |
| Nov 2018 | 40.81 | 60,310 | £8,198 | 39.63% |
BCA COO UK Remarketing Stuart Pearson commented, “November was another strong month for LCV sales at BCA with good levels of demand and average values well ahead year-on-year. BCA is offering a broad selection of attractive and desirable stock from a wide range of corporate and dealer sources and this is keeping buyers interested and prices firm.”
He added “Professional buyers are competing strongly for LCVs that are in ready-to-retail condition, particularly any vehicles with a high specification or unusual configuration. At the budget end of the market, older, higher mileage vans are selling providing they are priced in line with market expectations and in good cosmetic condition.”
“BCA Live Online bidding has been very strong and increased competition from online buyers is keeping values high. There is continued demand for vehicles to go straight to work in the parcel delivery and courier sectors to meet the needs of the online retailers.”
Fleet and lease LCVs averaged £8,198 in November, maintaining a run of strong values that started in March of this year despite average age and mileage continuing to rise in recent months. Values were ahead of the same period last year by £471 (6.0%) with retained value against MRP (Manufacturer Recommended Price) falling marginally to 39.63%.
Year-on-year table: Fleet & lease vans
| Fleet/Lease | Avg Age (mnths) | Avg Mileage | Avg Value | Sale vs MRP |
| Nov 2017 | 39.07 | 60,530 | £7,727 | 38.13% |
| Nov 2018 | 40.81 | 60,310 | £8,198 | 39.63% |
Average part-exchange LCV values in November were the fourth highest on record at £4,569. Year-on-year values increased by £61 (1.3%), despite both comparative age and mileage rising, the latter by over 7,000 miles.
Year-on-year table: Part-Ex vans
| Part-Ex | Avg Age (mnths) | Avg Mileage | Avg Value |
| Nov 2017 | 77.58 | 84,843 | £4,508 |
| Nov 2018 | 80.84 | 91,901 | £4,569 |
Nearly-new LCV values averaged £16,131 at BCA in November, with year-on-year values well ahead by £1,086, equivalent to a 7.2% uplift compared to the same month in 2017. As always, these values have to be taken in the context of the volumes reaching the market, the model mix factor and availability of stock.
Year-on-year table: Nearly-new vans
| Nearly-new | Avg Age (mnths) | Avg Mileage | Avg Value |
| Nov 2017 | 8.66 | 9,760 | £15,045 |
| Nov 2018 | 9.19 | 11,075 | £16,131 |